Manage Alerts
From the Alerts panel, you can edit or delete an alert schedule, or open a data snapshot from the time the alert was scheduled (continue reading below for details).
You can also click on an alert to load its Job Executions panel (yellow arrow), which displays a list of all the alert jobs that were run for the given alert. You can click on a job execution to load its Output panel, where you'll see the details of that

Alerts Panel
The alerts panel displays a list of all alerts configured for the specified data discovery, with the following columns for each alert:
- Actions: you can edit or delete the alert, or open a data snapshot of the discovery from the time the alert was created,
- Name: the name by which the alert was saved.
- Type: whether the alert was a one-off or recurring.
- Owner: the user who created the alert.
- Start Date: the date the first alert job will run or was run.
- End Date: the date the last alert job will run or was run (if an end date was defined).
- Creation Date: the date the alert was created.
Click the refresh button (purple arrow below) to refresh the list of alerts.

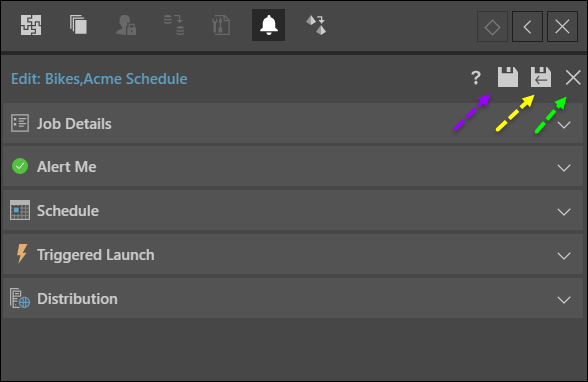
Edit Alerts
If you clicked Edit from the Actions column of an alert, the Advanced Alert panel will open, where you'll be able to edit the alert, its schedule, configure a triggered launch, and set the distribution. Click here for details.
Click Save (purple arrow below) to save changes to the alert. Click Save and Run (yellow arrow) to save changes and run the alert job immediately. Click Cancel (green arrow) to discard changes and return to the Alerts panel.
Job Executions Panel
The Job Executions panel displays a list of all job executions for the selected alert, with the following columns for each job execution:
- Actions: from here you can re-run the job.
- Progress: whether the job was executed successfully, failed, or is currently in progress.
- Run-Time: the date and time the job was run.
Click Refresh (purple arrow below) to refresh the list of job executions.

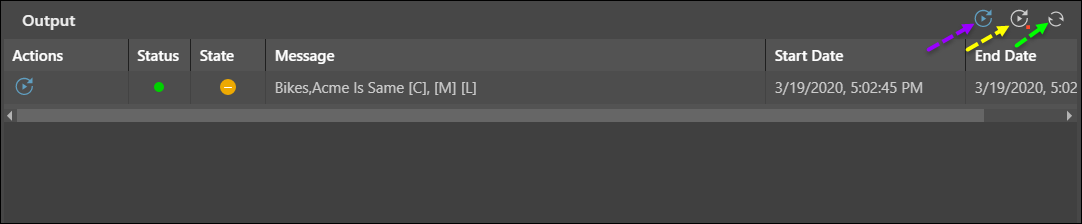
Output Panel
The Output panel displays the output for the selected job execution, with the following columns for each output row:
- Actions: from here you can re-run the job.
- Status: whether the job was successfully executed or not.
- State: the icon displayed in the alert output.
- Message: the message displayed in the alert output.
- Start Date: when the alert job started.
- End Date: when the alert job ended.
Click Rerun All (purple arrow below) to rerun all alert jobs listed in the Output panel.
Click Rerun All Failed (yellow arrow) to rerun all failed alert jobs in the Output panel.
Click Refresh (green arrow) to refresh the output list.